—TELEDIAGNOSIS PLATFORM


UX/UI & App Design — Energy Infrastructure 2020—present
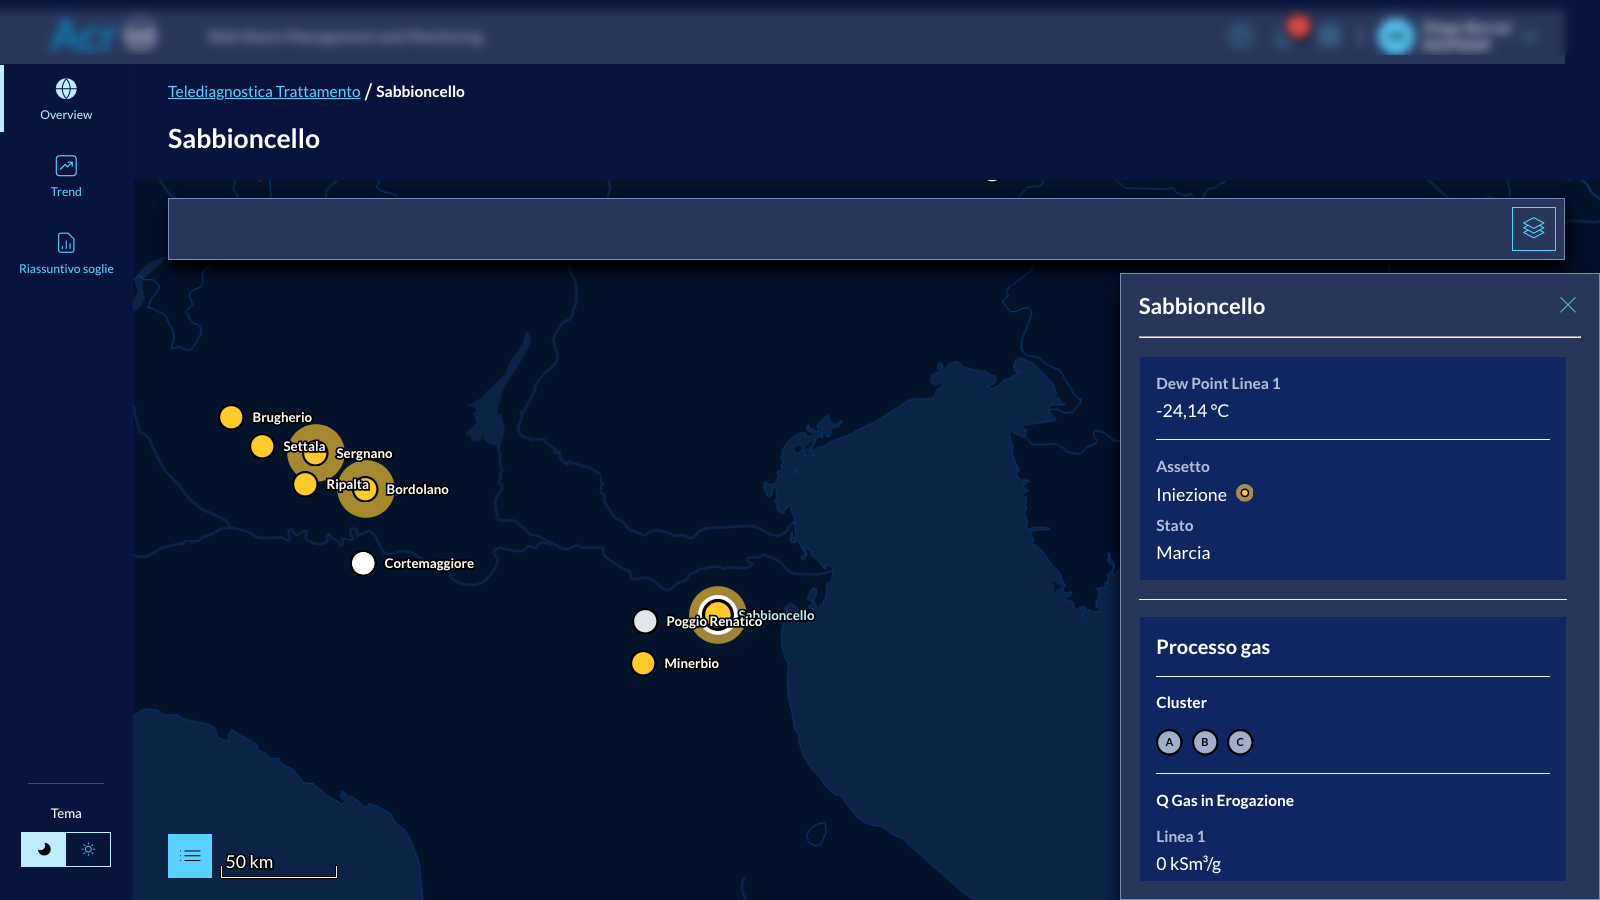
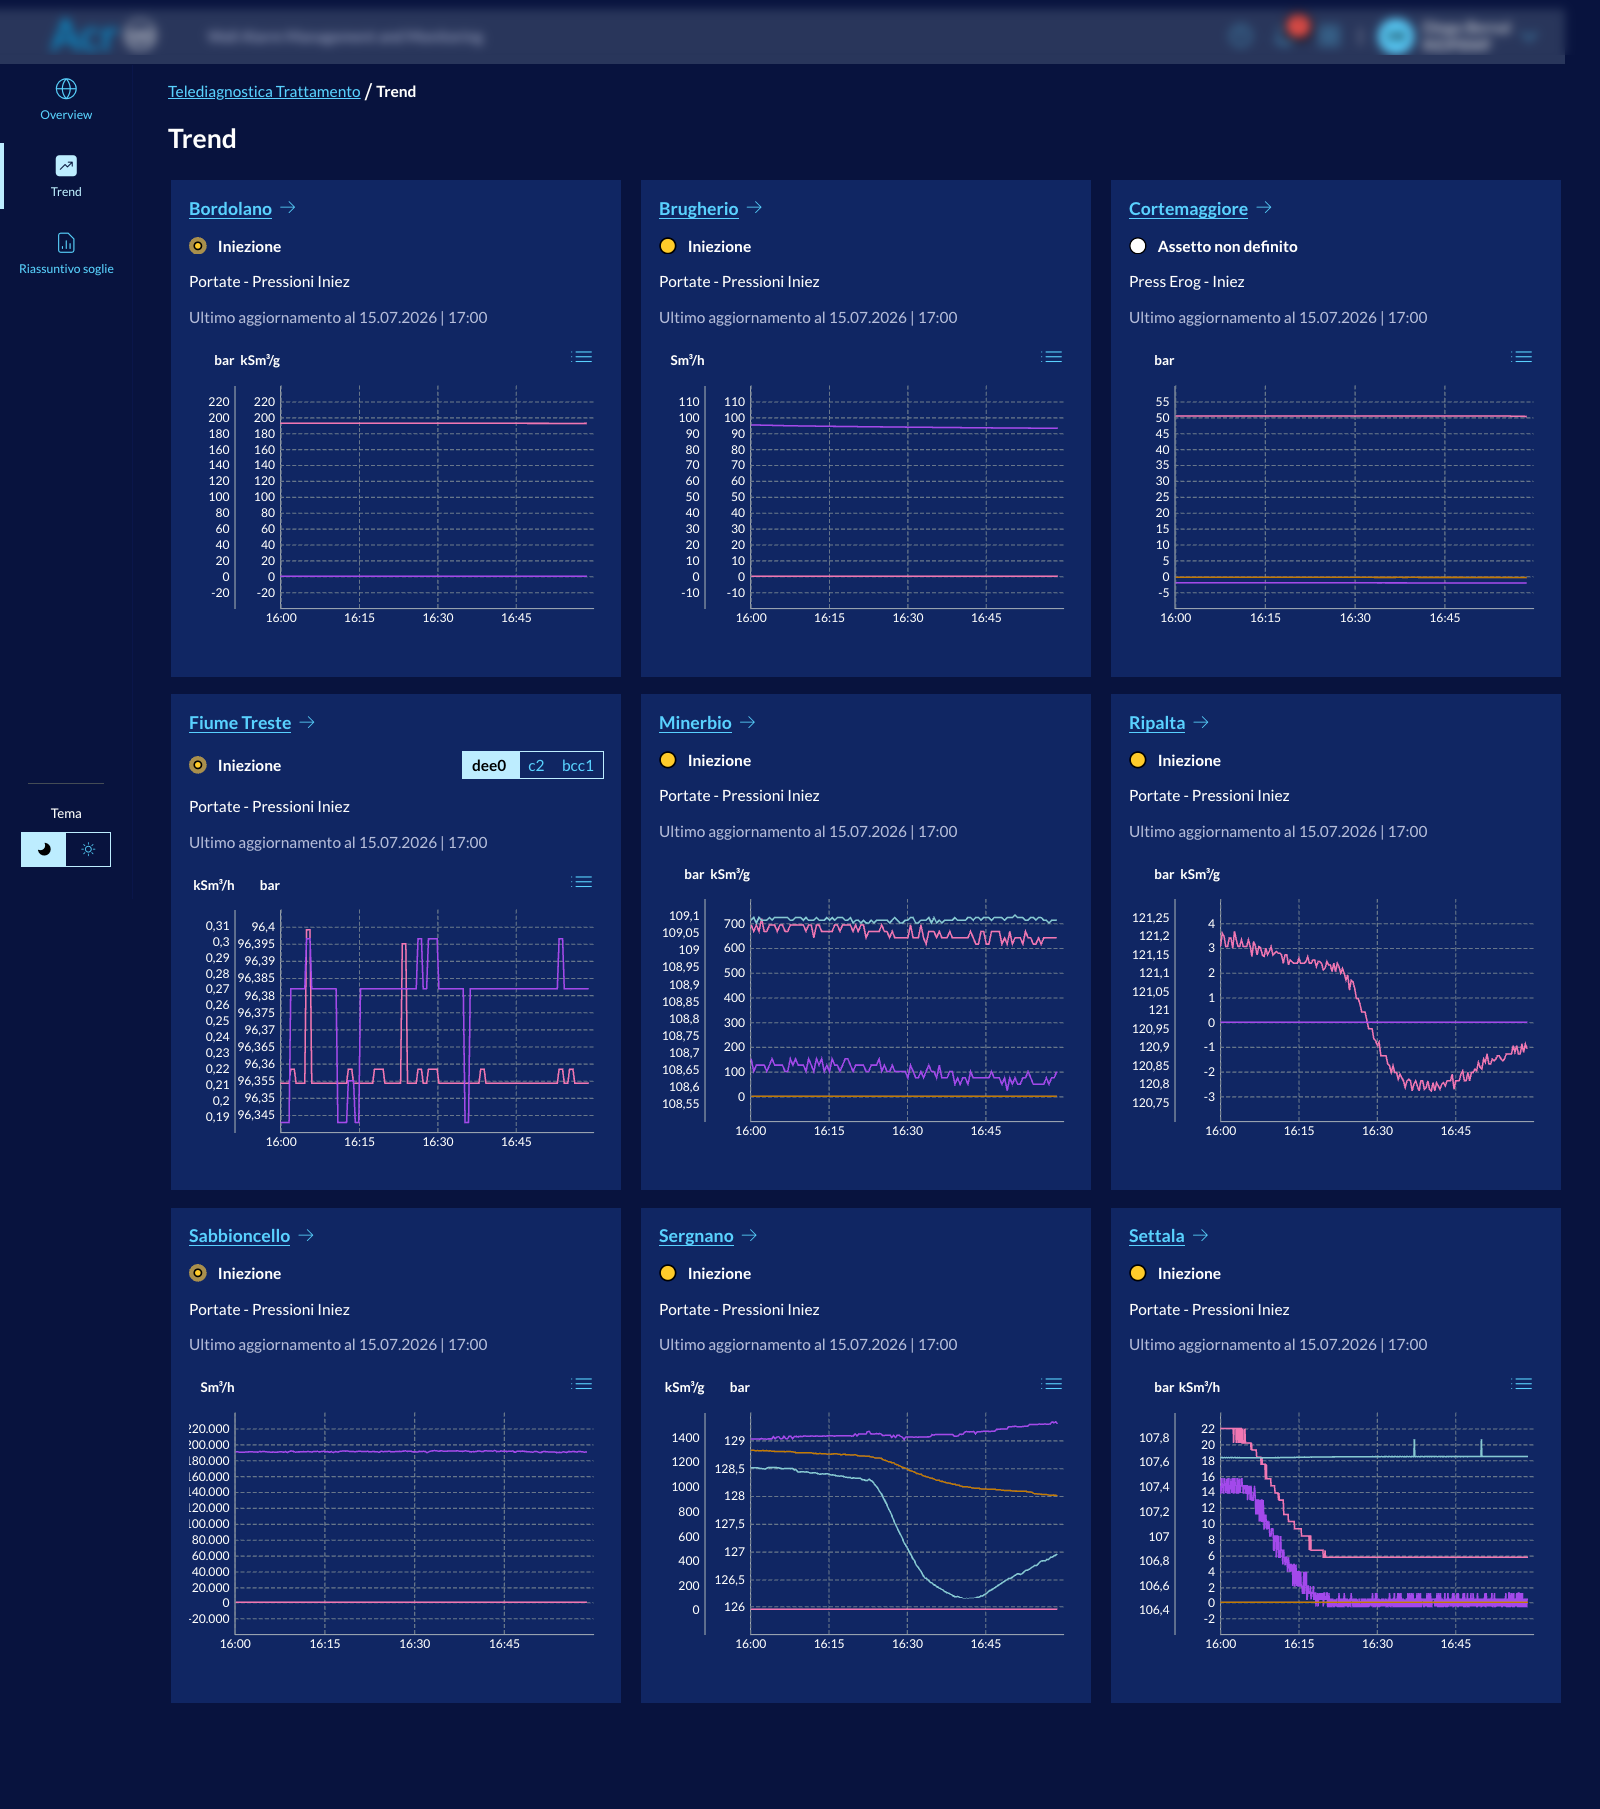
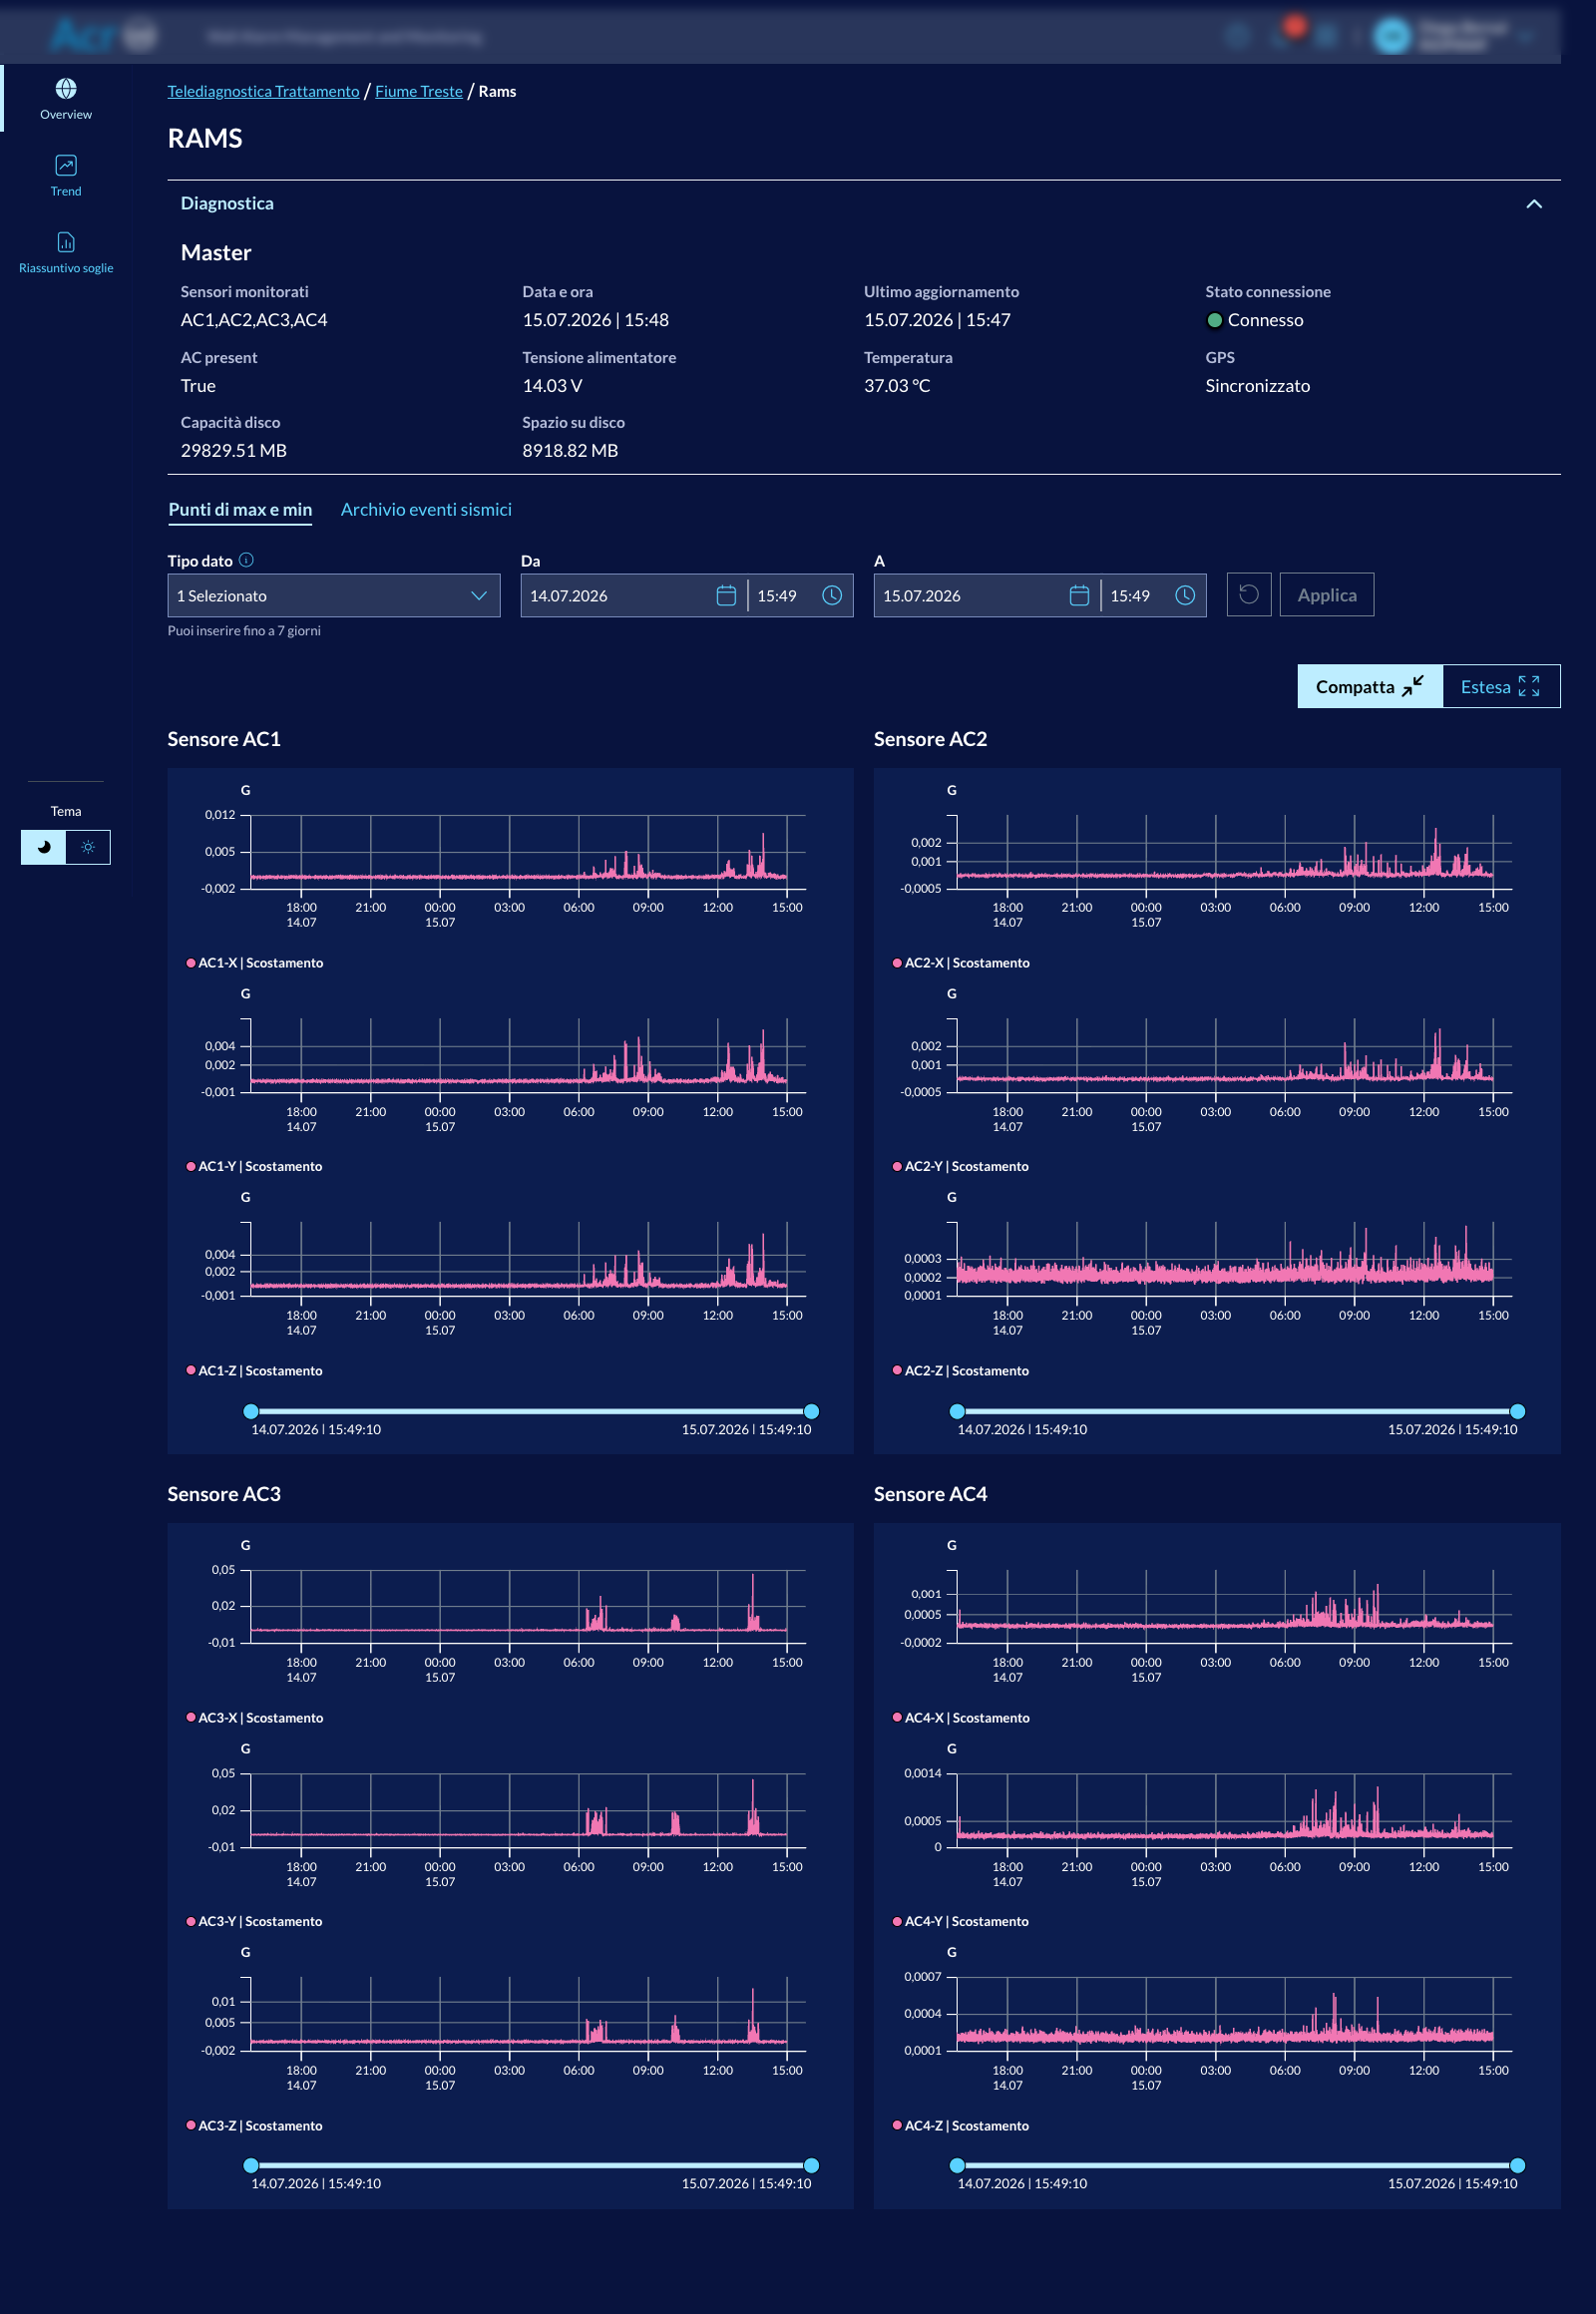
Telediagnosis is a real-time monitoring and diagnostic platform for industrial turbocompressors across a national gas network. It connects 21 compression plants — 68 machines in total — collecting over 74,000 signals at one reading every three seconds: more than 1 billion IoT data points per day. The platform runs on corporate intranet, accessible from desktop and mobile, and serves operators and maintenance engineers with tools for live monitoring, historical analysis, and predictive diagnostics.
What it does:
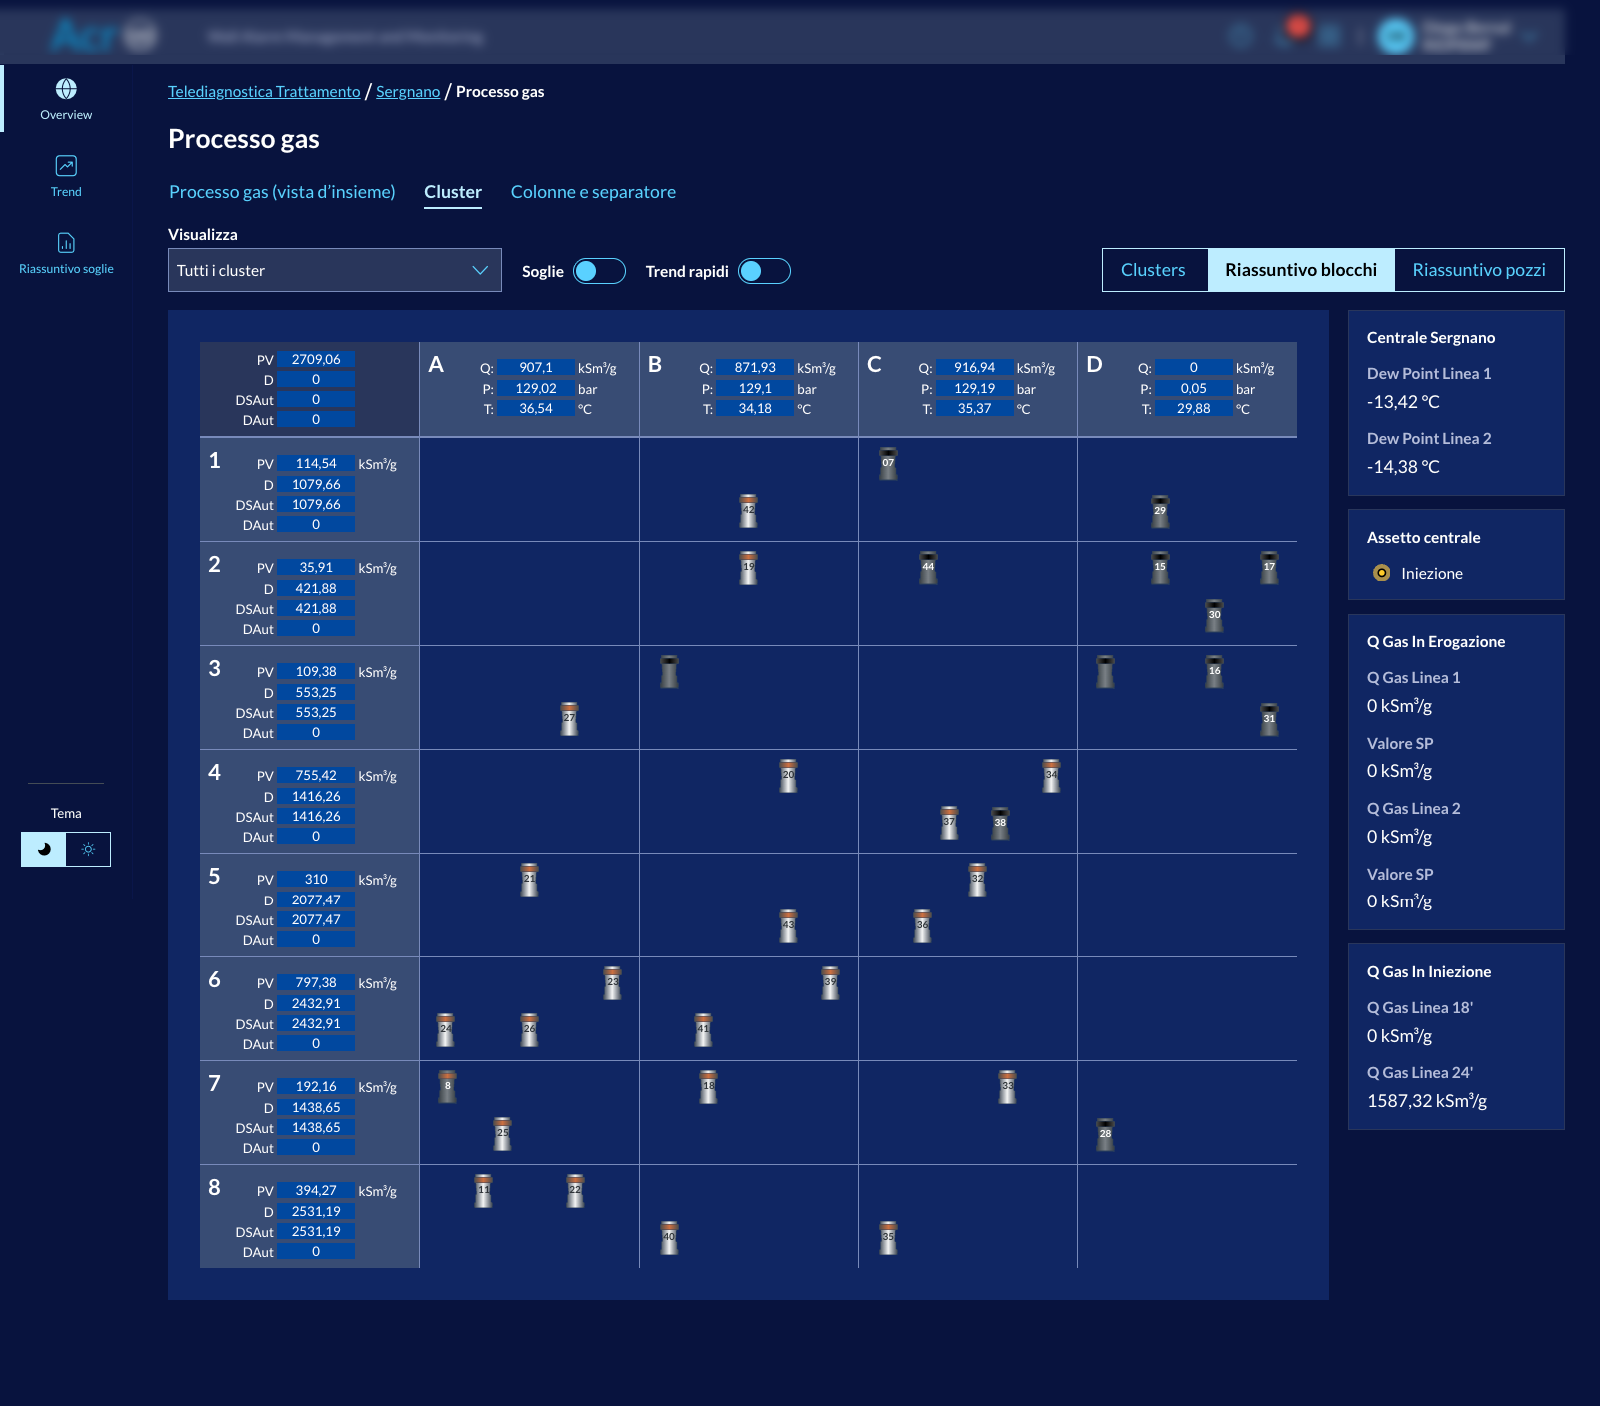
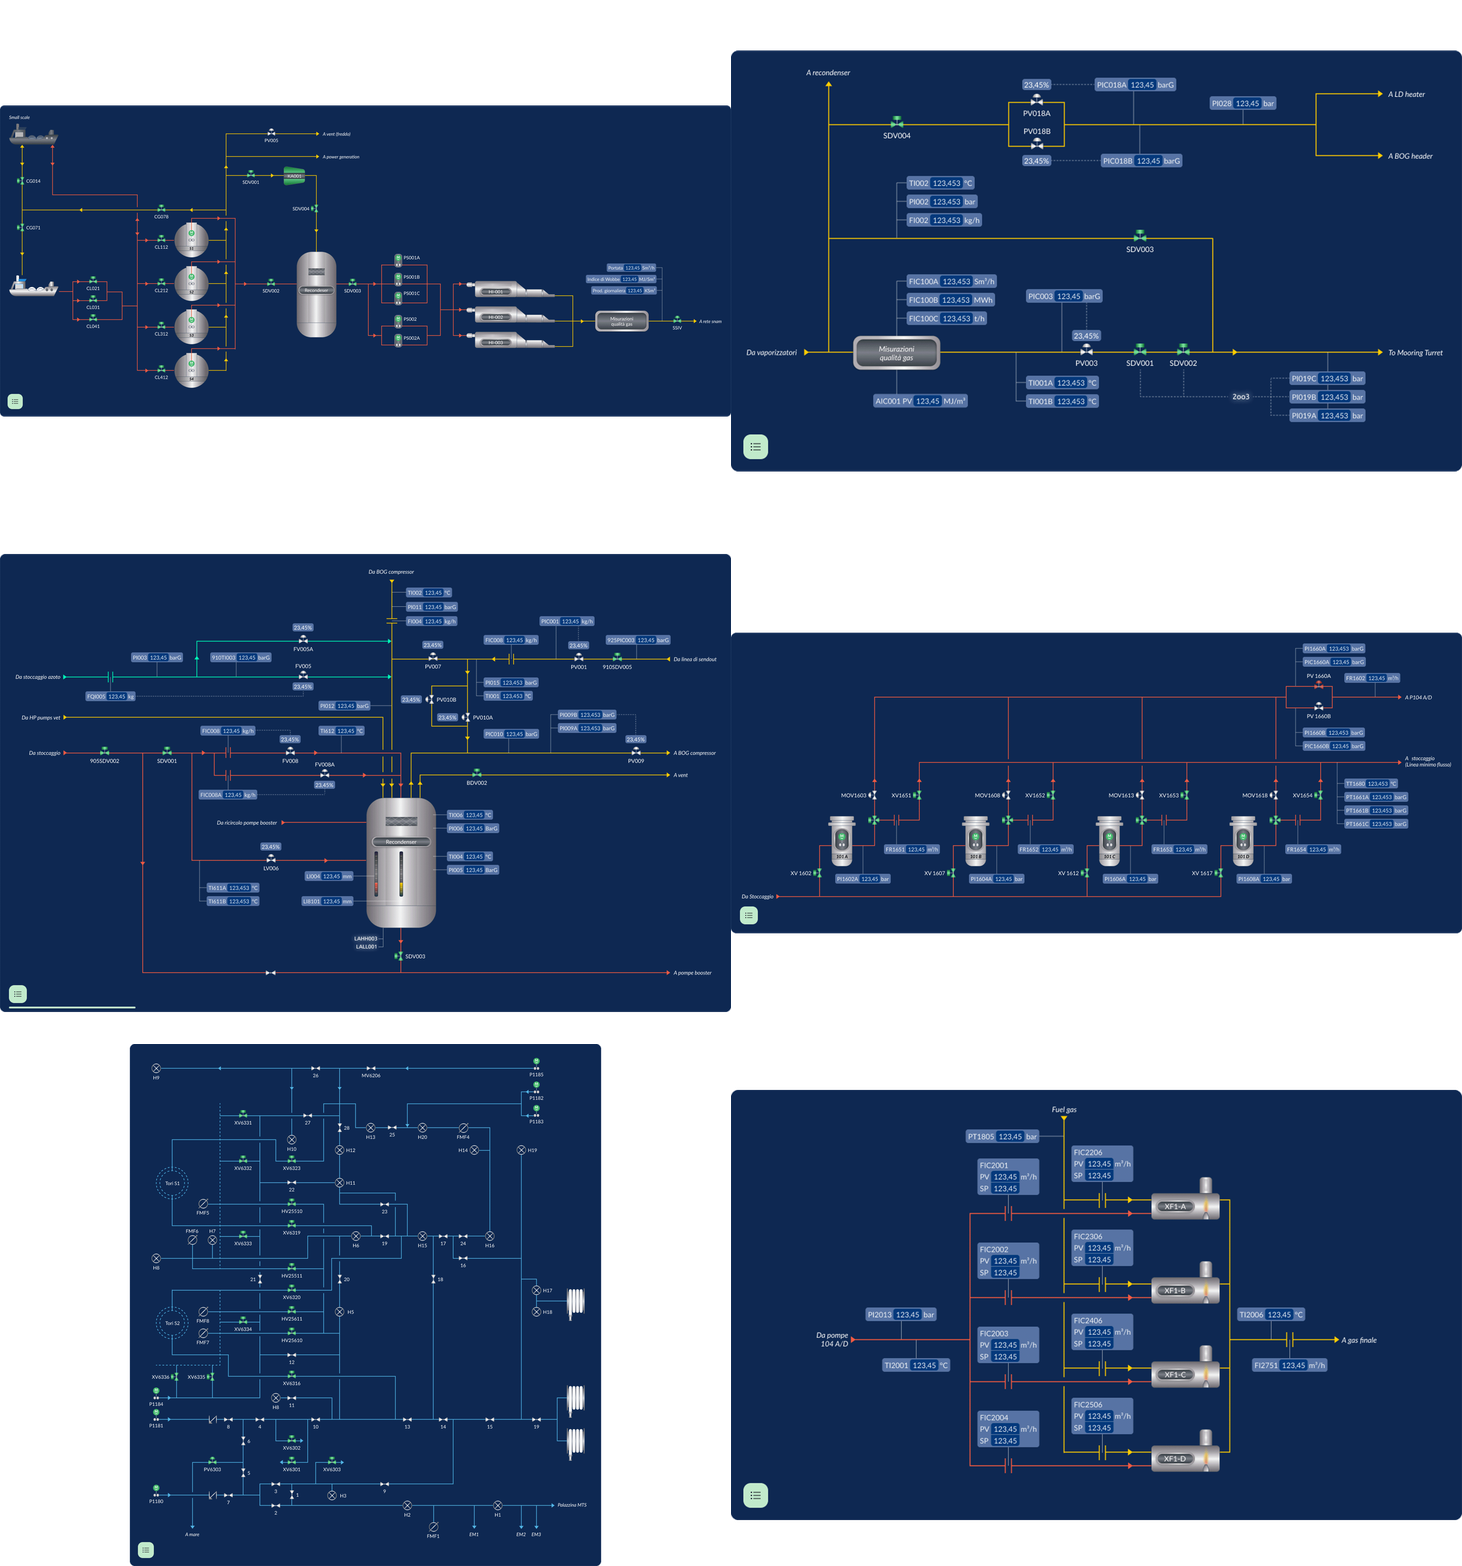
The platform operates across three modes. Real-time monitoring surfaces live data per plant and machine — operators can define diagnostic thresholds per signal, enabling remote condition monitoring and early anomaly detection without being on site. Historical analysis provides a custom trend builder: users compose multi-signal charts, set time ranges, and apply analysis tools to explore how machine behaviour evolves over time. A performance section renders machine performance curves and the current working point — calculated on-edge — and lets engineers modify curve parameters directly from the UI when operating conditions change. Each of the 6 machine types monitored was graphically modelled in full detail, reflecting the actual mechanical differences between machines produced by different vendors.
Design focus:
The project started with direct user research — semi-structured interviews with three user types: plant technicians, business figures, and a diagnostic engineer profile that had no dedicated tool. Their input drove a full IA redesign: the existing system ran on four vendor platforms with no consistency, and two sprint iterations produced a six-section hierarchy that worked across all facilities.
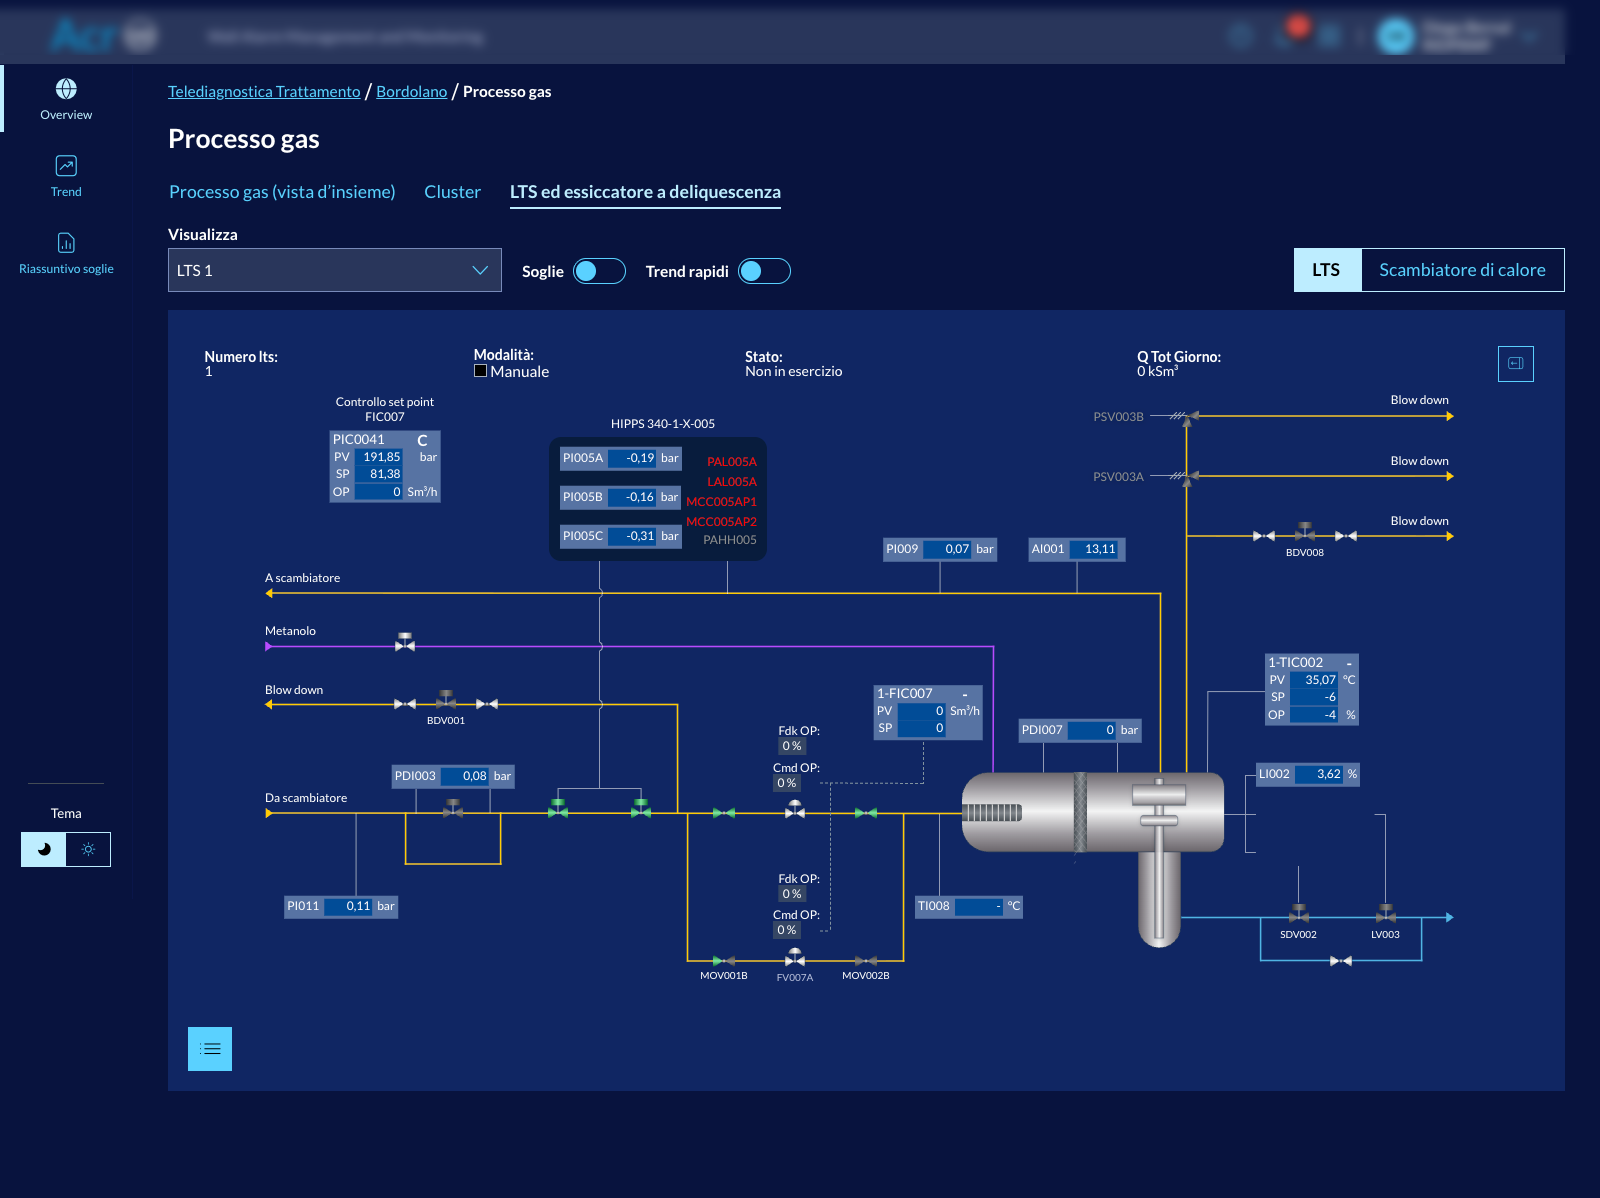
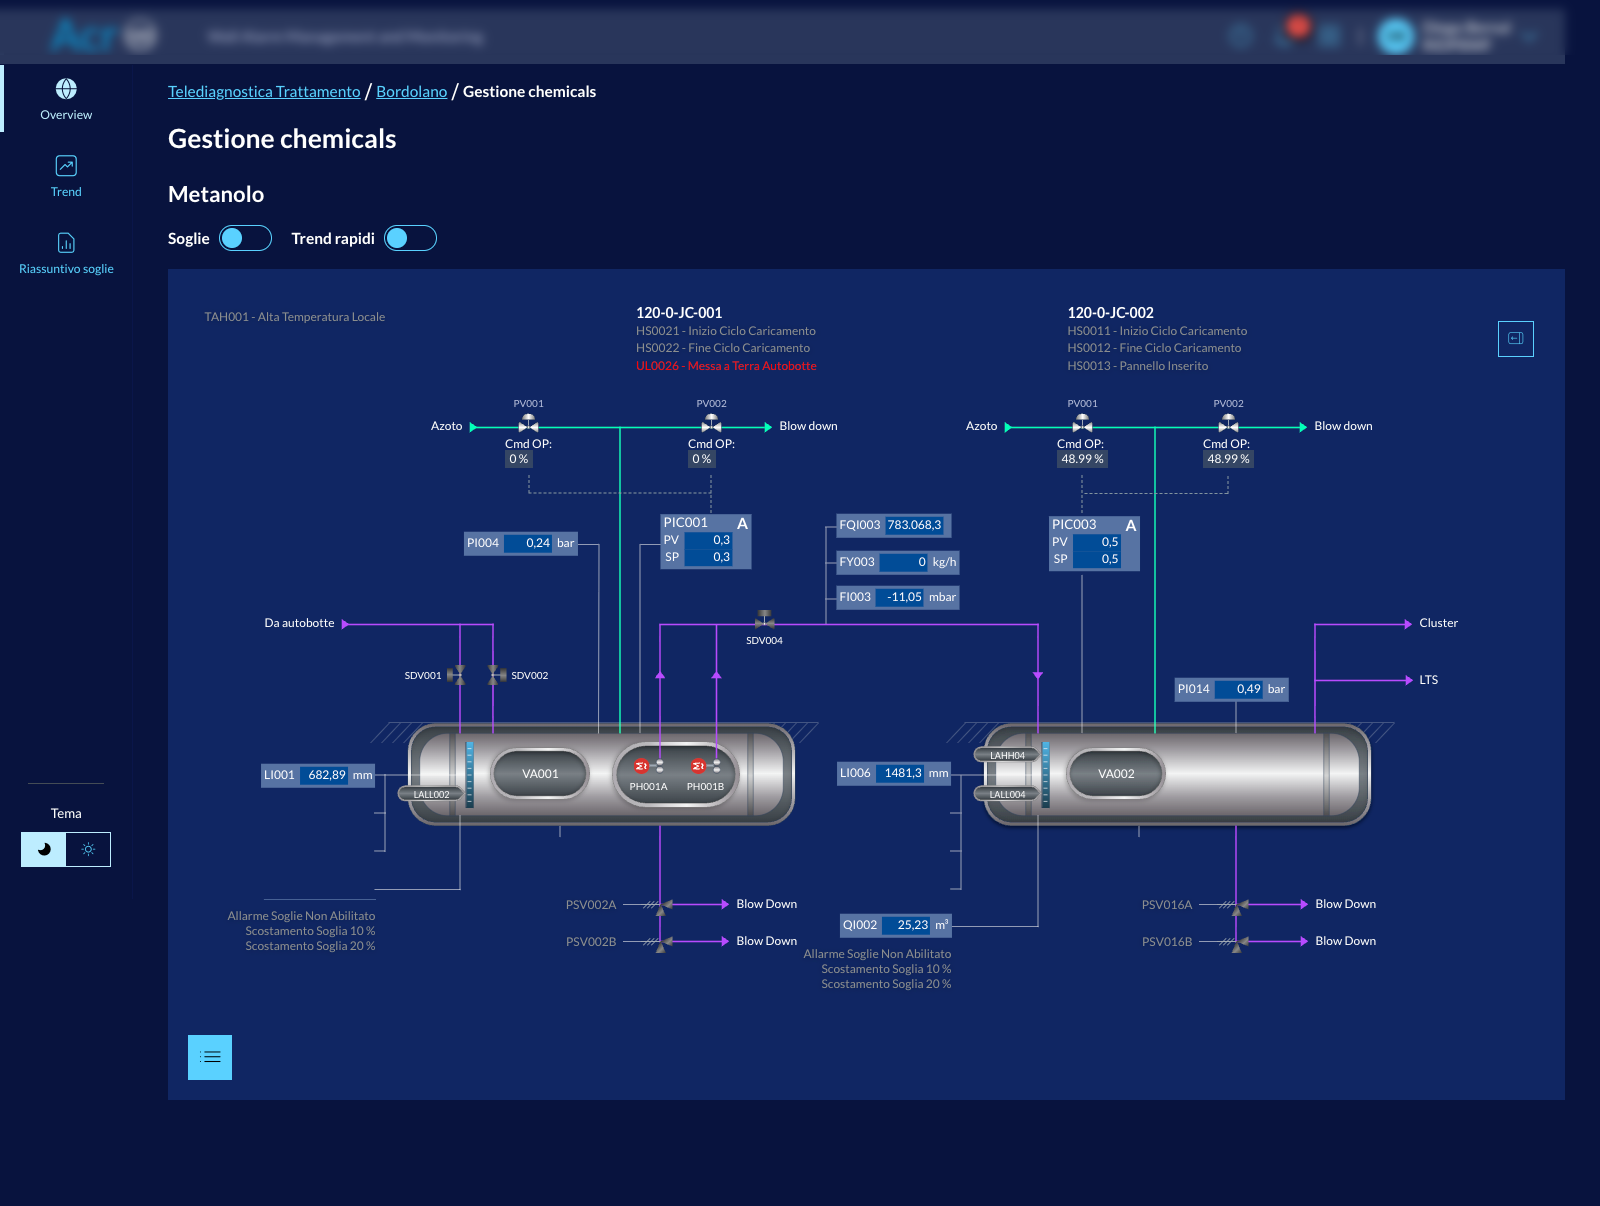
Making 1 billion daily data points legible for operators who need to act on them. A significant part of that work was designing the visual language for all 6 machine types from scratch — following an engineering-first approach so the interface reads the way operators already read technical schematics. Each machine is represented as a live diagram: graphical components map directly to sensor states, valve positions, and alarm conditions, giving engineers a spatial mental model they can use under operational pressure. This visual language had to be built from within the platform's existing design system, keeping the machine models native to the interface rather than foreign to it. Beyond the machine models, the threshold configuration and trend generation tools required their own design logic — translating complex data configuration into interfaces that non-specialist operators could use without training.
The challenge:
One interface, 68 machines, 6 different mechanical architectures, and 74,000 live signals — all from different vendors, with different protocols and data structures. The first design problem was information architecture: what an operator needs at a glance versus what they dig into. The second was building a precise visual language for 6 mechanically distinct machine types while staying within the constraints of an existing design system — the models had to feel native, not imported. The third was mode-bridging: real-time and historical data live in different mental models, and the platform needed to serve both without fragmenting the experience. The fourth was evolution: the platform grew from basic monitoring into a predictive diagnostics tool across multiple phases, requiring design decisions that could expand without breaking the existing interface. The fifth was consistency: one interface had to unify plants that previously ran on four different vendor systems, each with its own visual language, navigation logic, and data structure — a fragmentation that users had absorbed as normal and that the new IA had to dissolve without losing the domain knowledge embedded in it.